Edge Groups: An Approach to Understanding the Mesh Quality of Marching Methods
Carlos A. Dietrich, Carlos Scheidegger, Joao Comba, Luciana Nedel, Claudio T. Silva. IEEE TVCG 14(6):1651-1658, 2008.
Marching Cubes is the most popular isosurface extraction algorithm due to its simplicity, efficiency and robustness. It has been widely studied, improved, and extended. While a lot of early work was concerned with efficiency and correctness issues, lately there is a push to improve the quality of Marching Cubes meshes so that they can be used for computational experiments. In this work we present a new classification of MC cases that we call Edge Groups, which helps elucidate the issues that impact the triangle quality of the meshes that the method generates. This formulation allows a more systematic way to bound the triangle quality, and is general enough to extend to other polyhedral cell shapes used in other polygonization algorithms. Using this analysis, we also discuss ways to improve the quality of the resulting triangle mesh, including some that require only minor modifications of the original algorithm.
Paper in PDF format (16MB).
Regenerating figures
Edge group datasets
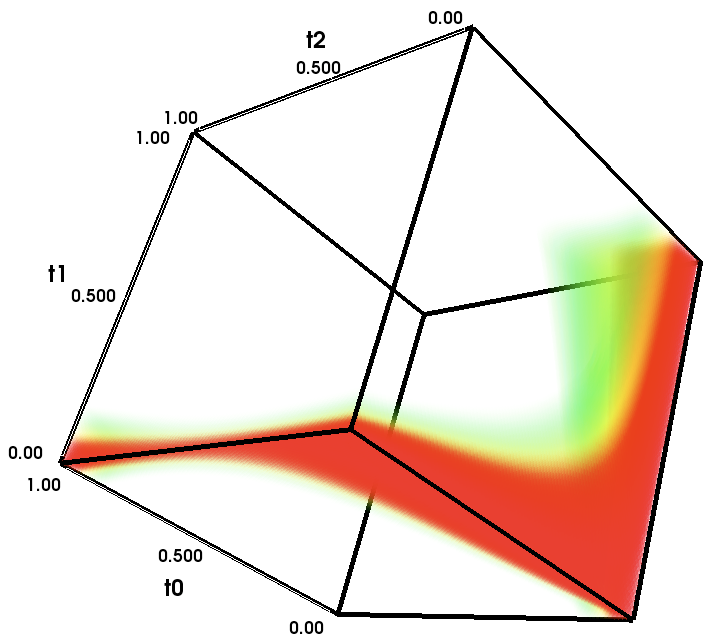
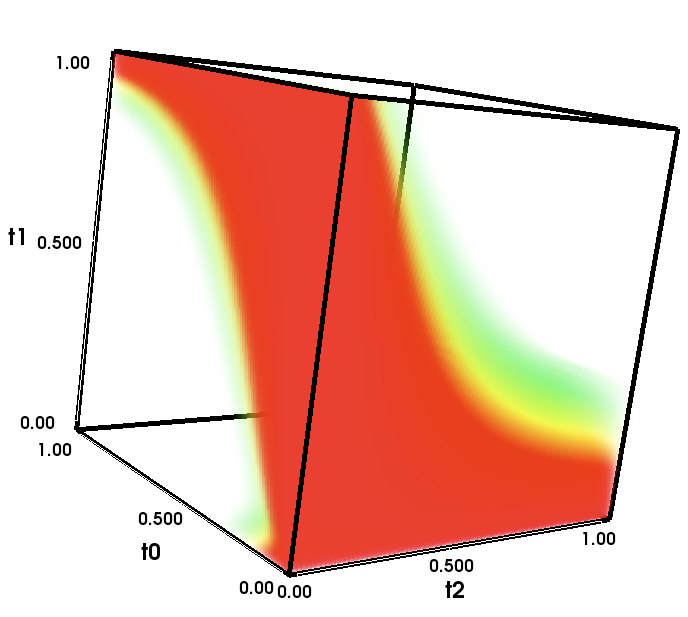
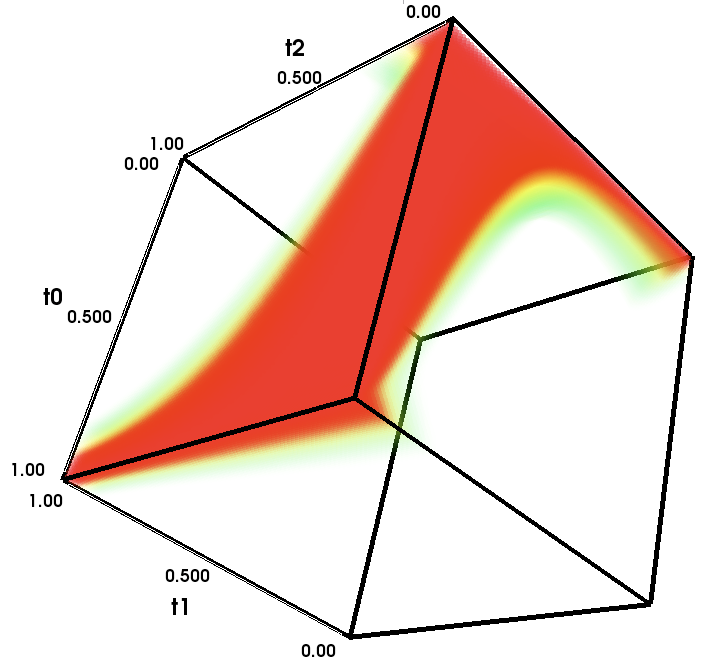
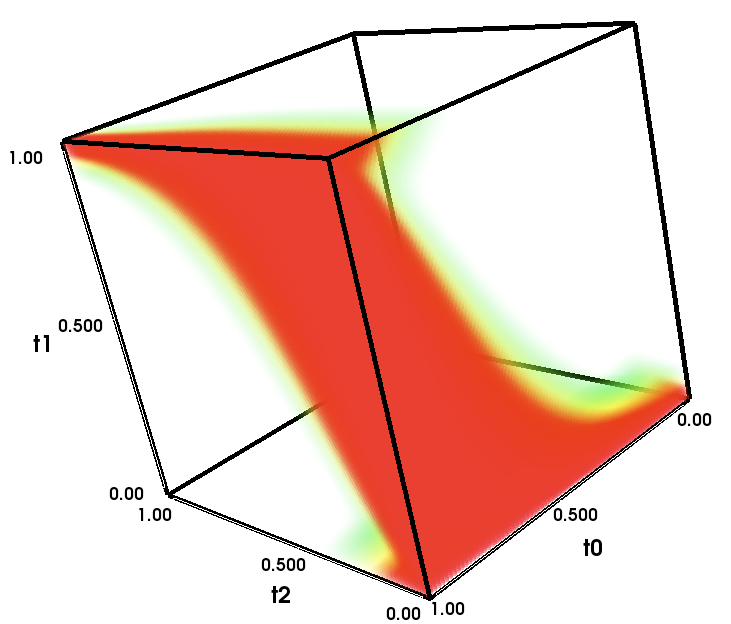
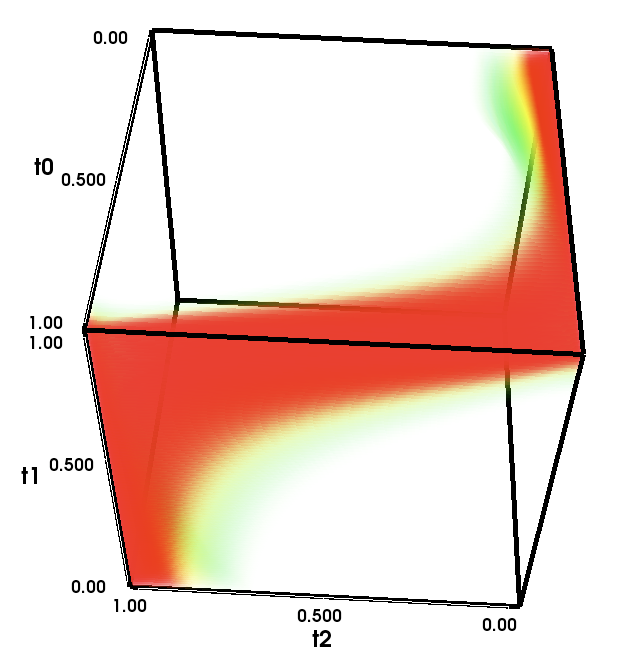
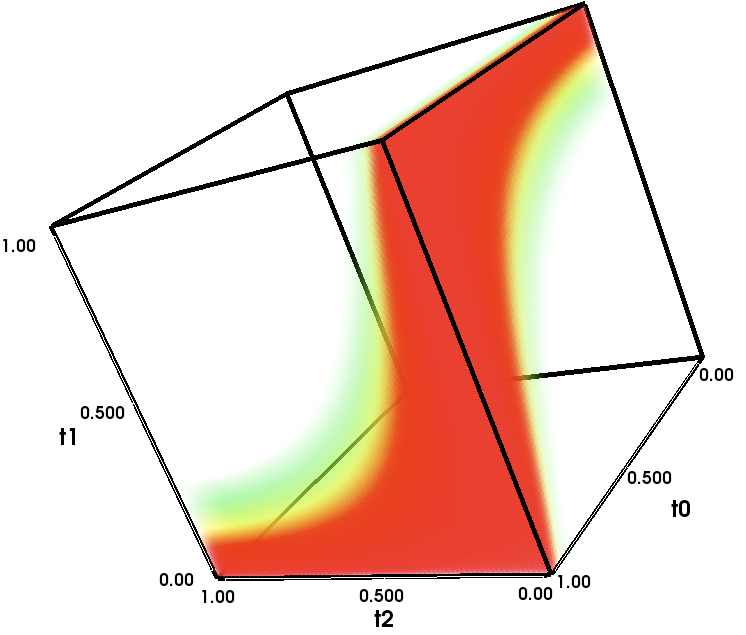
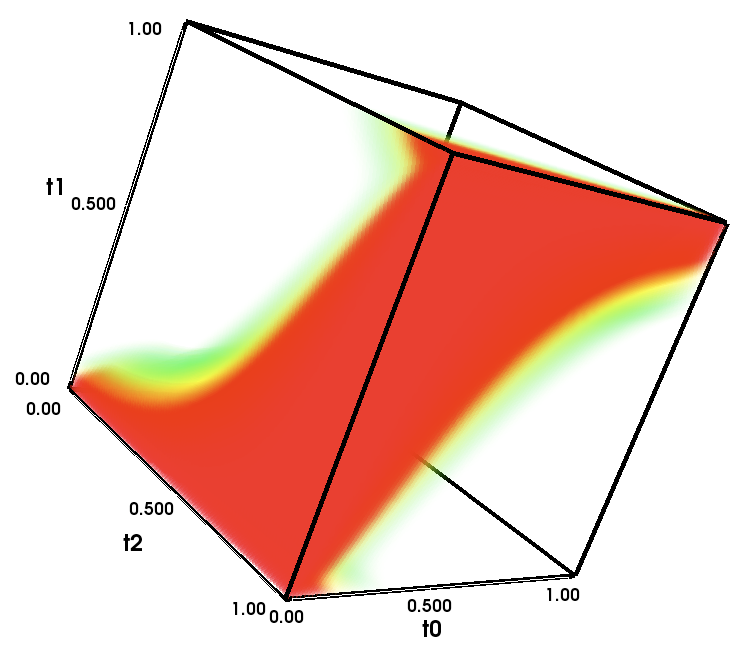
Archive with all the volumes used to generate the volume renderings of triangle quality per case, in VTK format.
- quality_volumes_float.zip, 32 bit floats (~150MB)
- quality_volumes_float.tar.gz, 32 bit floats (~150MB)
- quality_volumes_char.zip, 8-bit quantized (~8 MB) – recommended.
- quality_volumes_char.tar.gz, 8-bit quantized (~8 MB) – recommended.
Regenerate Volume Renderings
The volume renderings in Tables 1 and 5 were generated with VisTrails. Download the software and get the vistrail here. This vistrail actually downloads the 8-bit zip file above from the web and unzips a particular file inside it. Change the Unzip module to pick a different case. The available lattices are cubic, BCC and CFK, each with as many cases as described on the paper.
Cubic Lattice
BCC Lattice
CFK Lattice


Code, Scripts
The quality volumes were generated with a set of Python scripts. These scripts can also generate SVG files of parallel coordinate plots. You will need:
- Python 2.5 with a reasonably new version of numpy (we are currently running Ubuntu 8.04 (Hardy Heron)’s version on Linux, and the MacPorts version on Macs).
- teem, compiled with VTK support.
- The teem python bindings.
Download the scripts into a new directory and run them according to the instructions in the files. The main files are parallel_coordinates_svg.py, quality_histogram.py and quality_volume.py.
Regenerate parallel coordinate plots
This visualization didn’t make it into the final paper - we include it here for completeness. The script will generate an SVG file. Notice that most SVG renderers are slow, so if you want a nice parallel coordinate plot, expect Firefox to take a few seconds to render. Run the script as follows:
./parallel_coordinates_svg.py lattice case number_of_lines > output_svg_file
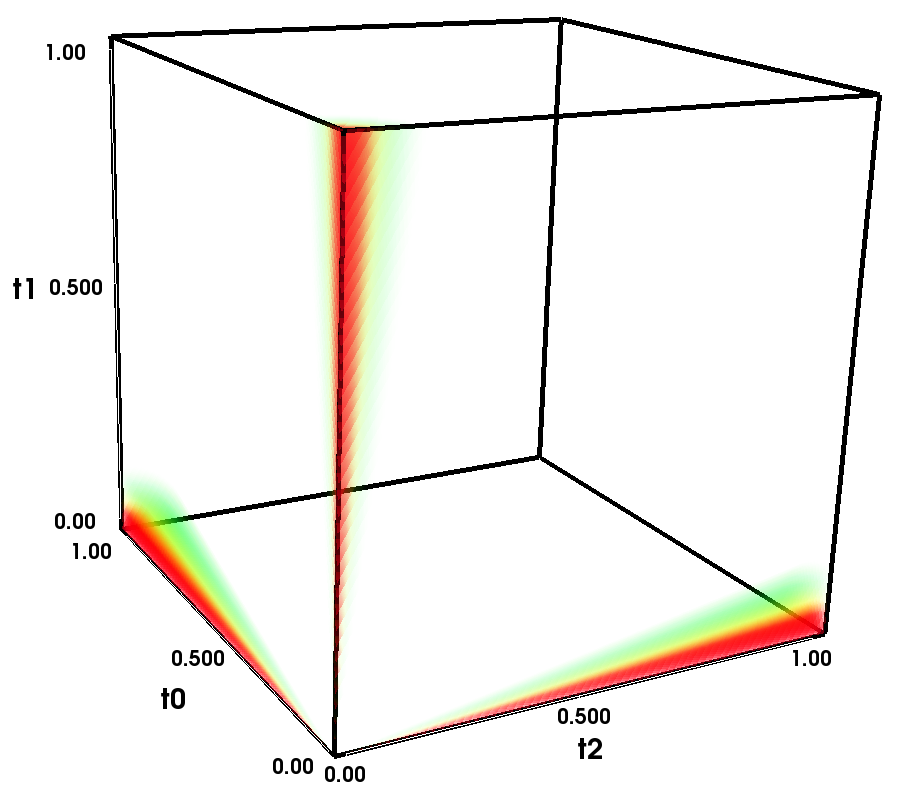
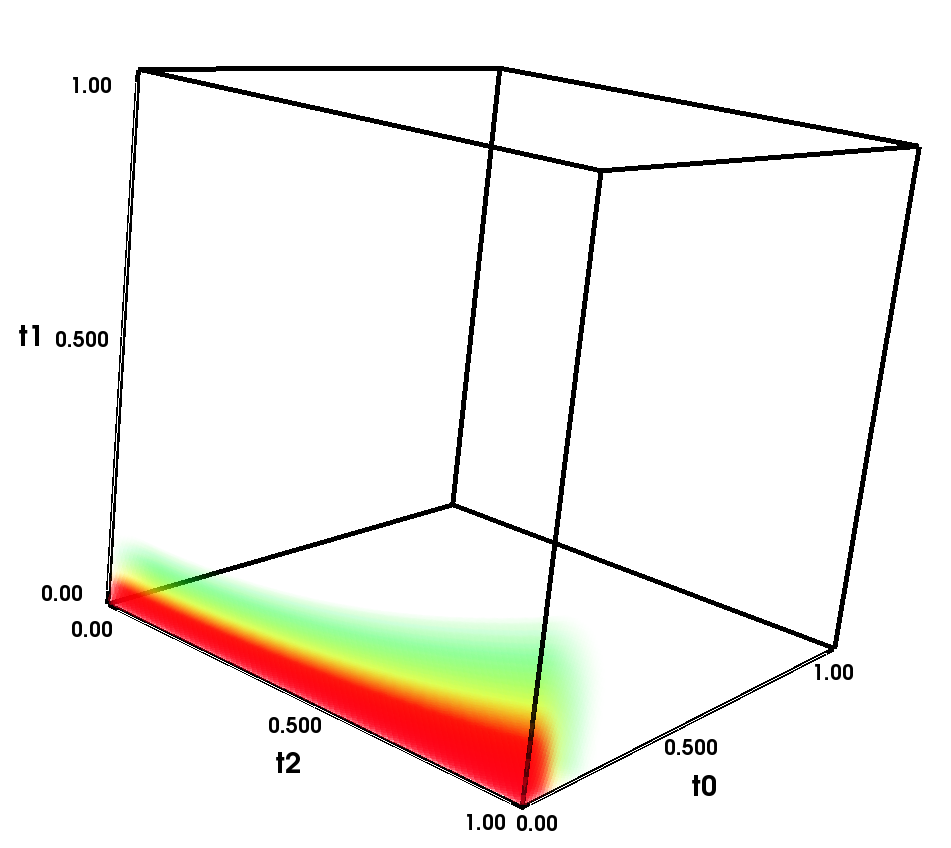
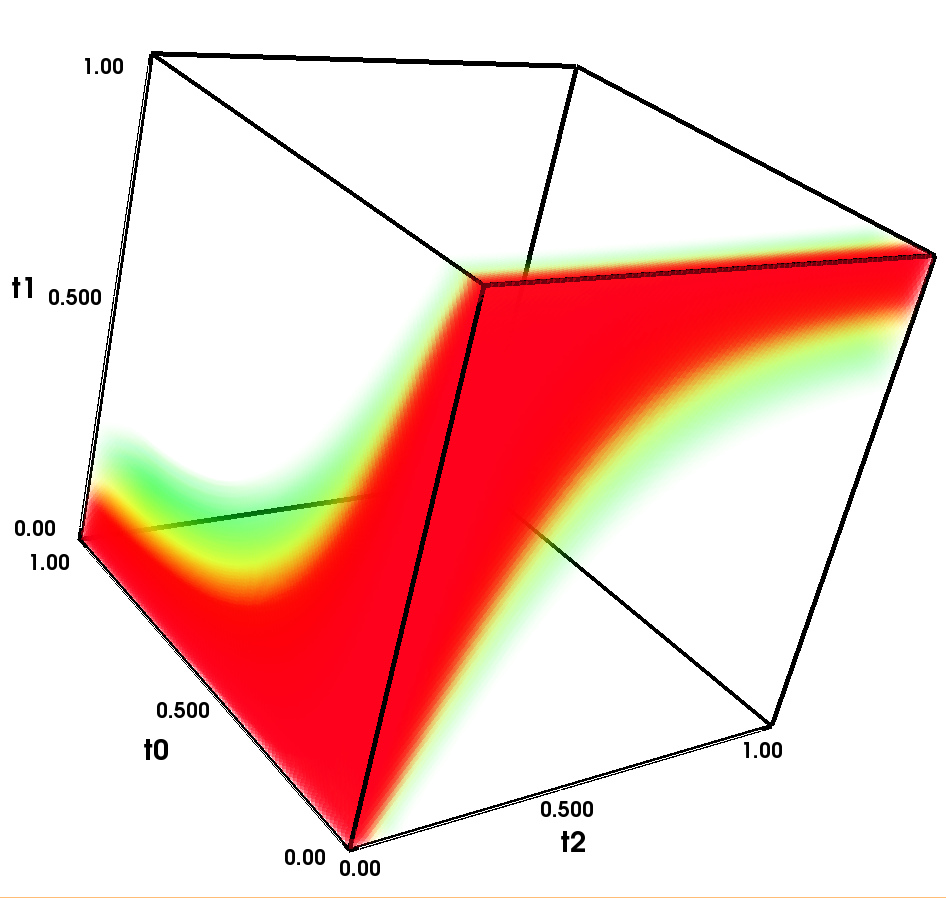
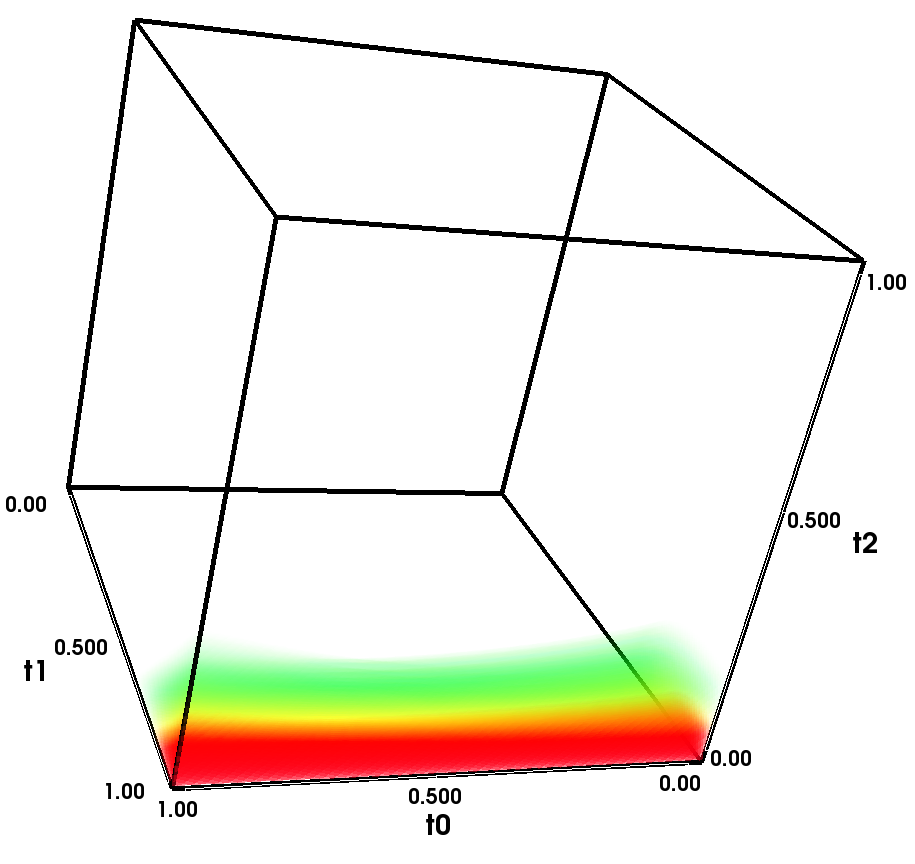
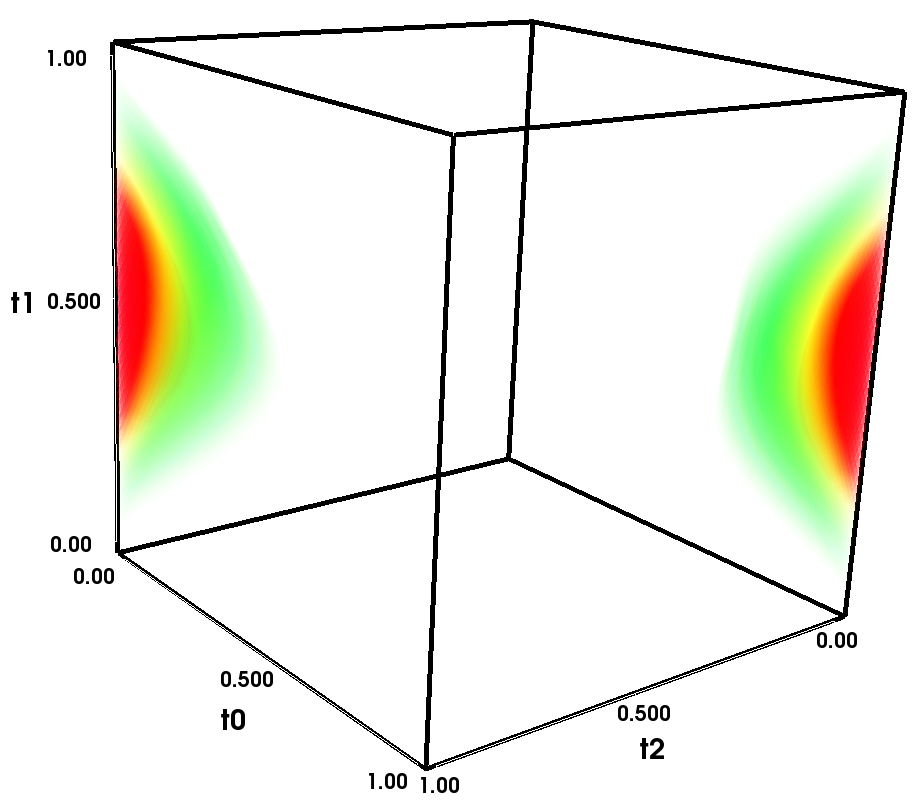
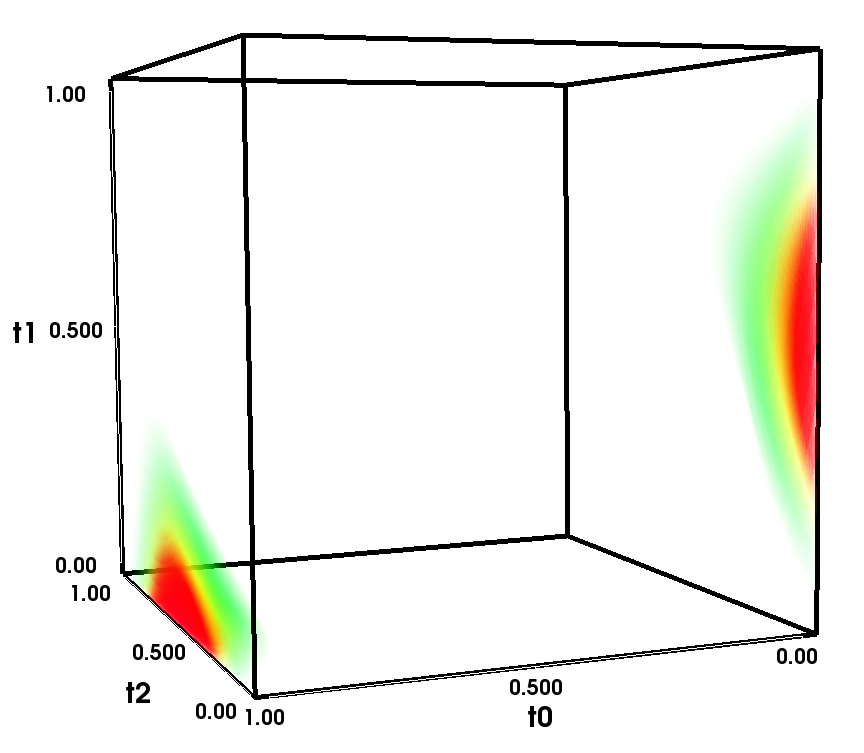
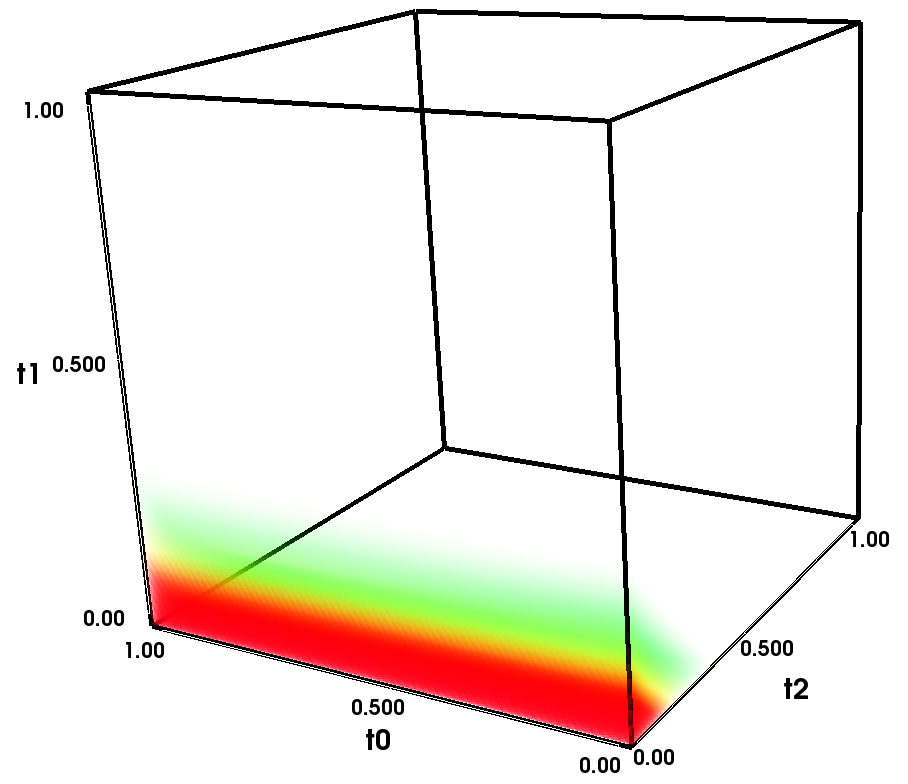
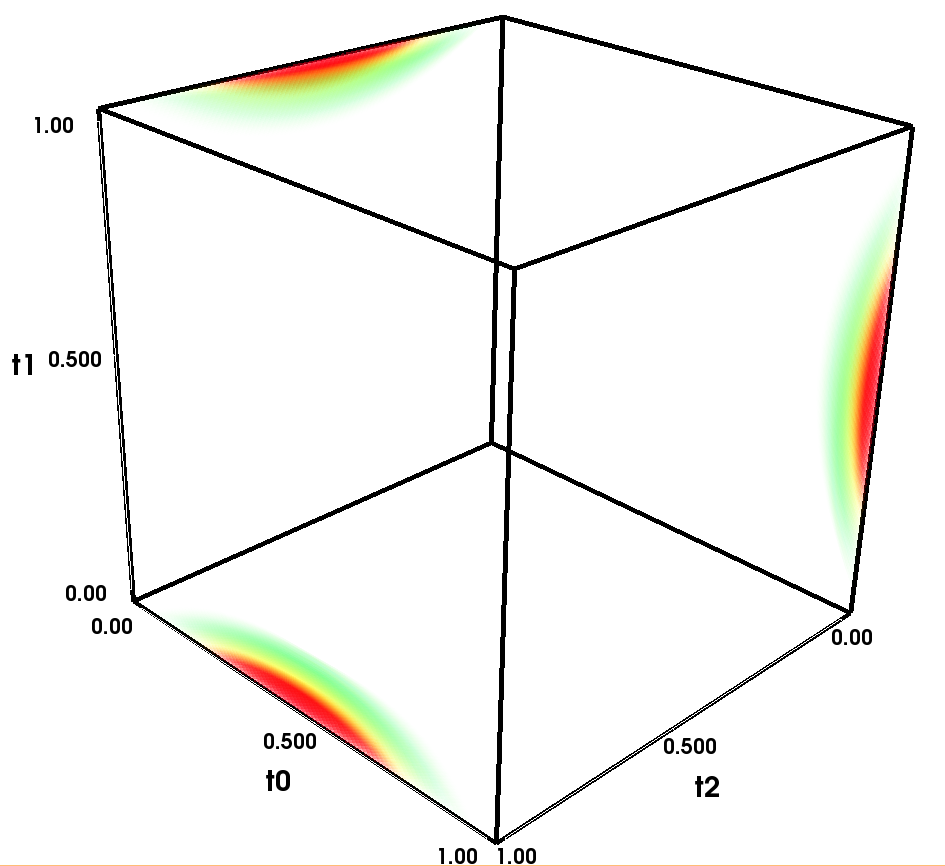
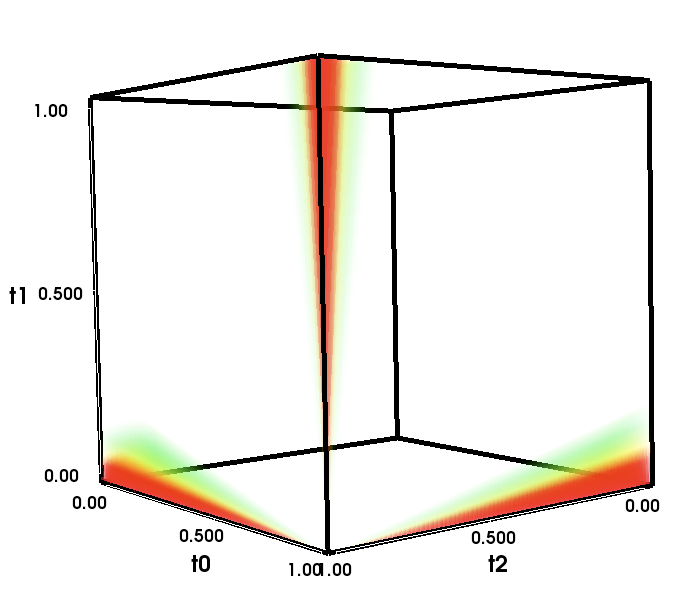
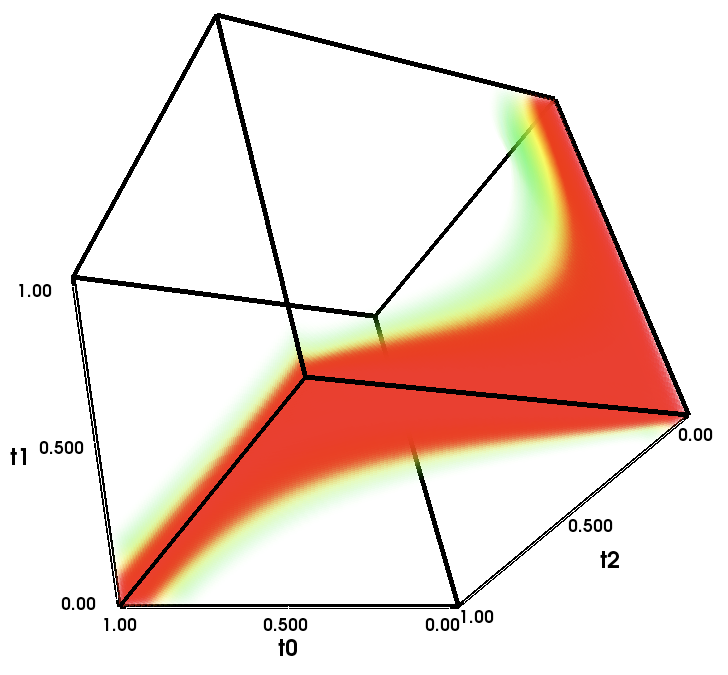
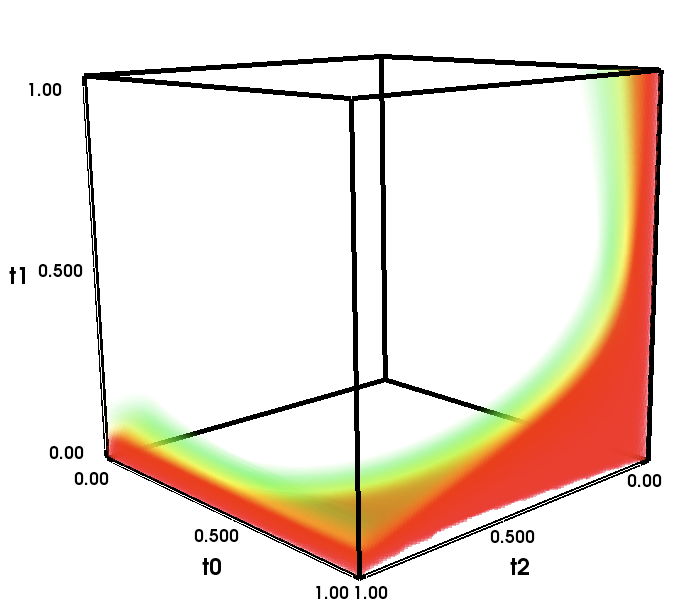
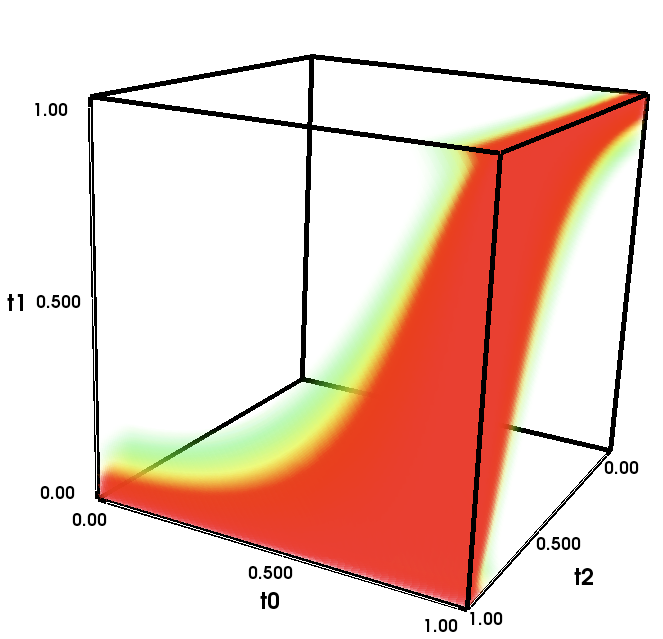
Parallel Coordinate Plots
These illustrations are meant to highlight the worst-case edge configurations for each case. We only show the bottom 5% quality of each case - anything above that is fully transparent.
Cubic Lattice


Note: The colorbar for cases 4, 5 and 7 is slightly wrong. The numbers in the colorbar are actual indicators of minimum and maximum quality, but the color scale is closer to what the other cases show. In these cases, black is around 0.7, while no lines with quality above 0.77 are shown.
BCC Lattice


CFK Lattice


Datasets
These datasets are stored in NRRD format.
- Silicium - Courtesy VolVis SUNY Stony Brook.
- Engine - Courtesy General Electric.
- Lobster - Courtesy VolVis SUNY Stony Brook.
- Bonsai - Courtesy Bernd Tomandl and Stefan Roettger
Talk slides
PDF file with slides of talk (7.7MB)
Source code
2009-02-08: Tarball of source code with Makefiles for Linux and OSX: here. This version incorporates recent changes we made to the code, including a few tricks to remove edge group 2 entirely from the table (see talk slides for more details), and our CiSE article. Macet is GPL v2.