Collaborative Visual Analysis with RCloud
Stephen North, Carlos Scheidegger, Simon Urbanek and Gordon Woodhull. IEEE VAST 2015 (conference track).
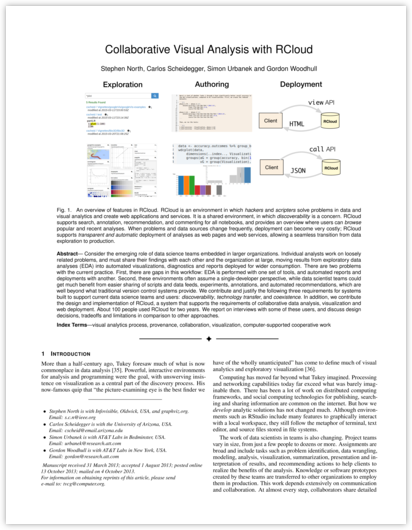
Consider the emerging role of data science teams embedded in larger organizations. Individual analysts work on loosely related problems, and must share their findings with each other and the organization at large, moving results from exploratory data analyses (EDA) into automated visualizations, diagnostics and reports deployed for wider consumption.
There are two problems with the current practice. First, there are gaps in this workflow: EDA is performed with one set of tools, and automated reports and deployments with another. Second, these environments often assume a single-developer perspective, while data scientist teams could get much benefit from easier sharing of scripts and data feeds, experiments, annotations, and automated recommendations, which are well beyond what traditional version control systems provide.
We contribute and justify the following three requirements for systems built to support current data science teams and users: discoverability, technology transfer, and coexistence. In addition, we contribute the design and implementation of RCloud, a system that supports the requirements of collaborative data analysis, visualization and web deployment. About 100 people used RCloud for two years. We report on interviews with some of these users, and discuss design decisions, tradeoffs and limitations in comparison to other approaches.
Paper in PDF format.
RCloud is an open source project from AT&T Labs.
