Course Review
- Posting date: Nov 29th
- Due date: Dec 12th
- Assignment name for
turnin:cs444_assignment_11
In this assignment, you will answer a sequence of questions that covers the entirety of the contents of this course. Note that you have two weeks to finish this assignment.
You will submit a single plain-text file called answers.txt. The
first line of your submission will have your name, and will be
followed by a blank line. Each of your answers will start with 1. ,
2. , etc. and will end with a blank line. For questions with
subproblems, use 5a. , 5b. , etc. Here’s an example if I were
submitting the assignment:
Carlos Scheidegger

1. This is the answer to the first question. It has some more
text.

2. This is another answer.

3. d

4. This is a bad visualization because XYZ.

5a. True.

5b. False.

5c. True.

...
Answer each question using no more than 50 words. Each question is worth 5 points (for a total of 105 points).
Questions
-
-
Write a CSS selector for all elements of class
node. -
Write a CSS selector for all
circleelements. -
Write a CSS selector the element with ID
main.
-
-
-
Write a JavaScript object with property names
countryandGDP, and property values"US"and16.77. -
Write a JavaScript array of all positive odd integers less than 10.
-
What’s the purpose of the
thiskeyword in JavaScript?
-
-
-
Write an SVG
lineelement that goes from point(0, 0)to(200, 200)and is drawn in blue. -
Without using d3, write a JavaScript snippet to create a
divelement, store it in the global variableelement, set its CSS class totitle, and its content toThis is a title.
-
-
-
Write a
d3expression that selects the element with idmain, appends ansvgelement, and sets its width and height to 300. -
Write a single
d3expression that appends arectelement for each value in the global variabledata(which holds a JavaScript array), and binds eachrectelement to each item ofdata.
-
-
-
You have a variable
scalethat was initialized as follows:scale = d3.scaleLinear().domain([0, 10]).range([200, 300])What’s the result of
scale(3),scale(5),scale(10), andscale(15)? -
You have a variable scale that was initialized as follows:
scale = d3.scaleLinear()
    .domain([0, 10])
    .range(["translate(0, 200)", "translate(200, 0)"])
What’s the result of
scale(5),scale(-5), andscale(20)?
-
-
-
How do human eyes distinguish between different colors?
-
What’s the most common form of color vision deficiency?
-
-
Which of the following color spaces is more appropriate for designing a color picker user-interface widget in a visualization, and why? (a) RGB (b) CMYK (c) HSV (d) Lab
-
Which of the following visual channels should you use in a colormap for categorical data, and why? (a) Hue (b) Saturation (c) Luminance
-
What’s the difference between separable and integral visual channel pairs?
-
Which property of the human visual system do treemaps take advantage of?
-
What are the three main ideas one should keep in mind when designing interactive visualization programs?
-
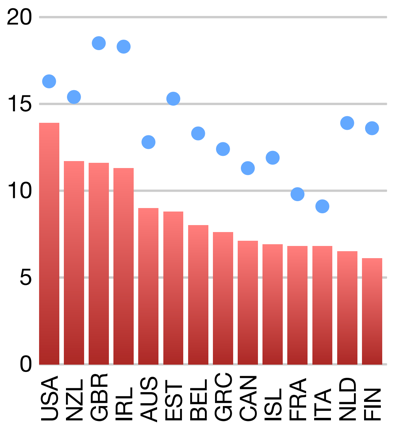
Describe two ways in which the following visualization is not effective:
-
What is the fundamental reason to plot data in a logarithmic scale?
-
The typical practice in visualization is to fix the width and height of the plot ahead of time. When plotting time series, describe why fixing the widths and heights of the plot might be ineffective.
-
Give two advantages (or two disadvantages) for choosing Scatterplot Matrices over Parallel Coordinate Plots.
-
When should you use the general technique of Multidimensional Scaling?
-
Describe the main forces in the standard force-directed layout of undirected graphs.
-
When are matrix diagrams sometimes better than node-link diagrams? When are they not?
-
The Marching Pentagons algorithm is the variant of Marching Squares where each cell is a pentagon instead of a square. If we count each case separately regardless of rotational or polarity symmetries, how many cases are there? If we do regard all symmetries as the same, how many cases are there, and more specifically, how many of each cases have zero, one, or two distinct line segments?
-
What’s the main disadvantage of plotting vector fields using a hedhehog plot?
-
-
If a map projection preserves area, what can we say about its Tissot’s indicatrices?
-
If a map projection preserves shape, what can we say about its Tissot’s indicatrices?
-