Assignment 2
- Posting date: August 30th 2018
- Due date: Sep 6th 2018
- Github classroom link: Assignment 2
Description
In this assignment you will create a simple webpage with some graphical content, using HTML, CSS, and SVG. These are basic building blocks that we will manipulate in later projects using Javascript and d3 in order to create visualizations. As such, it is important that you know how the pieces work on their own, before moving forward.
Assignment: create simple charts using SVG
The webpage you create will have five simple charts: two bar charts, two line charts and one pie chart (this is possibly the last time I’ll ask you to draw a pie chart in earnest: we’ll see why in the Principles part of the course).
You will draw each chart in an SVG element of size 400x400. The
elements for each SVG chart need to have specific id elements:
- bar chart with blue bars:
blue_bar_chart - bar chart with red bars:
red_bar_chart - line chart with line elements:
line_line_chart - line chart with path element:
path_line_chart - pie chart:
pie_chart
The name of the file should be index.html.
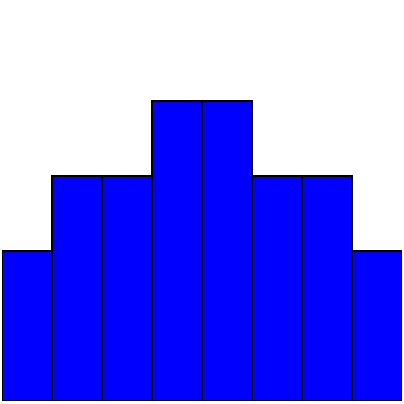
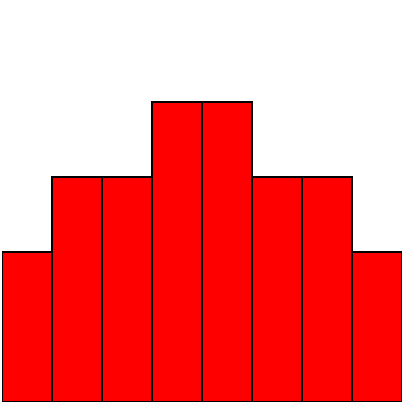
Bar charts
Your bar charts should take all horizontal space in the SVG (all 400
pixels). The individual bars should have the following height, in order: 150,
225, 225, 300, 300, 225, 225, 150.
You should create a bar chart with blue bars in the SVG element named
blue_bar_chart, and a bar chart with red bars in the SVG element
named red_bar_chart. In addition, the SVG elements inside each of
the main elements should be IDENTICAL. In other words: any
declarations that will influence the color of the bars need to be done
with the attributes of the different outer SVG elements and your CSS
declarations. It is important that you learn how to do this kind of
thing because it will enable you, later on, to write better
abstractions in d3. Better abstractions mean you can try more things
faster. Trying more things, as we discussed, means you will end up
with better visualizations.
The bar charts will look like this:
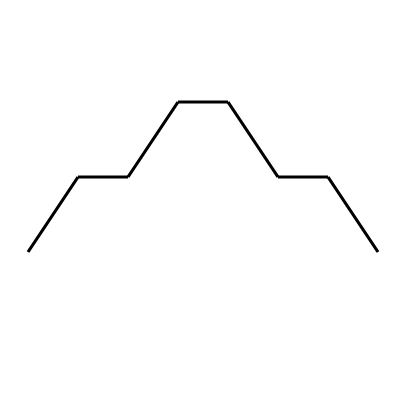
Line charts
Your two line charts will look almost identical. The first line chart,
with id line_line_chart, will be composed of SVG line
elements. The second line chart, with id path_line_chart, will be composed of a single path
element that will draw the polyline. The heights of the vertices in
the polyline should be the same as the heights of the individual bars
for your bar charts.
Both of your line charts will look very similar to this:
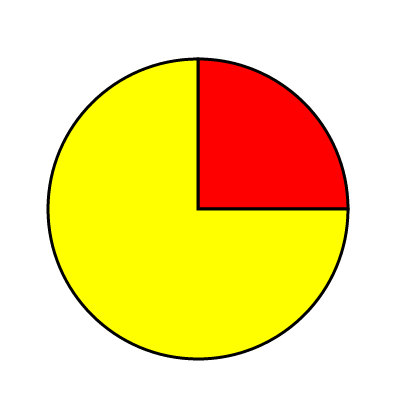
Pie Chart
Your pie chart, which will be an SVG element with id pie_chart, will
have two wedges. The first wedge will span 90 degrees and will be
red, and the second wedge will span the remaining 270 degrees, and
will be yellow.
Your pie chart will look very similar to this:
Assessment
-
20% of the grade will be given to submissions which succesfully validate as HTML5 according to the w3c validator.
-
16% of the grade will be given to submissions for each chart that gets full marks. The charts don’t have to look exactly like the ones here, but the general style should match: fill and stroke colors count, as do positioning of the elements, and respecting the constraints of the assignments (using the right elements and right declarations, as described above).
Resources
-
Mozilla Developer Network:
-
Scott Murray’s book, SVG section.