Assignment 9
- Posting date: Nov 19th
- Due date: Nov 26th 11:59PM MST
- GitHub classroom link: Assignment 9
Description
In this assignment, you will implement Marching Squares, one algorithm for generating contours of a 2D scalar field. We will use the same data as in assignment 6, the dataset with temperature and pressure measurements for a simulation of Hurricane Isabel. As usual, you will build on skeleton code we provide.
Data
The data is provided in two arrays: temperatureCells and
pressureCells. Each array contains objects that look like this:
{
    NW: value-at-nw-corner,
    NE: value-at-ne-corner,
    SW: value-at-sw-corner,
    SE: value-at-se-corner,
    Row: i,
    Col: j
}
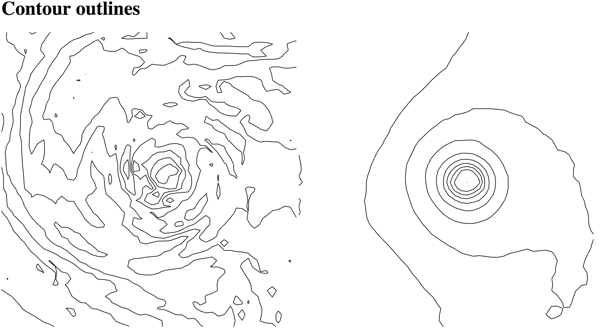
Part 1: Implement the computation of outlines contours (50 points)
Implement the computation of outline contours using marching squares
by filling out the skeleton code, specifically the function
generateOutlineContour. As in assignment 4, each square is 10x10
pixels.
The solution will look like this:

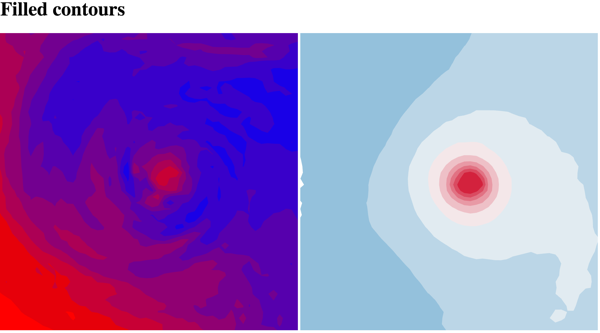
Part 2: Implement the computation of filled contours (50 points)
Implement the computation of filled contours using marching
squares by filling out the skeleton code, specifically the functions
generateFilledContour and includesFilledContour. As in assignment
4, each square is 10x10 pixels.
The solution will look somewhat like this:

Files in starter repo
main.jsis the skeleton you will build on (implement the functions commented with “write this”),index.htmlhas the HTML you’ll need, anddata.jshas the data you will use. Note that this is a different file from assignment 4, because the data is structured differently.
Hints
-
The way the skeleton code is set up, the path for each separate square can be specified in a “local” coordinate system (use your web browser’s debugger to inspect the DOM after executing the skeleton code and pay attention to the “transform” nodes in each of the
gelements). In other words, you do not have to write code to decide on what position along the SVG each square should be drawn. -
Before writing the full marching squares code, make sure you understand enough of what’s going on in the code. A good way to start is to write code that adds a fixed, small shape inside of each square.