Assignment 5
- Posting date: Feb. 12th, 2015
- Due date: Feb 26th, 2015, 1:59PM MST (It is due by thursday’s lecture)
- Assignment name for
turnin:cs444_assignment_5
Description
In this assignment, you will modify the axis.html example we went
over in class, to add the following features:
-
You will give each point a color using color scales created with
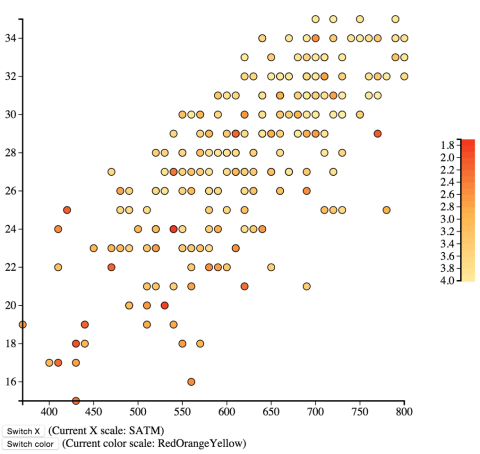
d3.scale, indicating the student’s GPA. There will be two color scales. (20/100)a. The first color scale will range from yellow to orange to red, using the following hex codes for the colors:
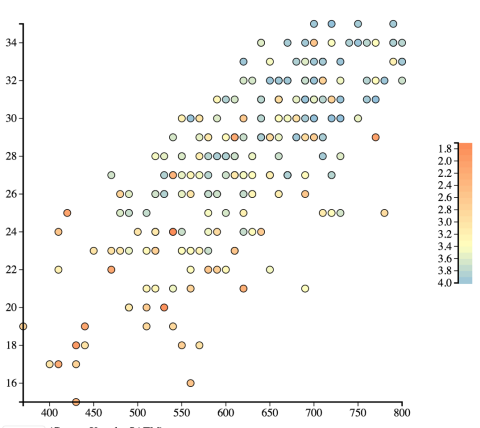
#ffeda0, #feb24c,
#f03b20
: this is Cynthia Brewer’s YlOrRd scale. Yellow should be mapped to the maximum GPA in the dataset, orange to the halfway point in the range, and red to the minimum GPA in the dataset.b. The second color scale will range from blue to light-yellow to red, using the following hex codes for the colors:
#fc8d59, #ffffbf,
#91bfdb
: this is Cynthia Brewer’s RdYlBu scale. Red should be mapped to the minimum GPA in the dataset, yellow to the AVERAGE GPA in the dataset, and blue to the maximum GPA in the dataset. -
Create a color legend for the current color scale, in the form of a vertical bar to either side of the original scatterplot. It should show the entire range of the colors assigned by the color scale, together with some tick marks indicating the corresponding GPA. (50/100)
-
Add animated transitions between the SATM and SATV scores. The animated transition should include an animation of the axis marks (10/100)
-
In addition to the transition between SATM and SATV scores that is already there, Add a button to switch between the two color scales. This button should change the color of the points, and the legend (20/100).
Start your assignment by copying
scatterplot.html,
scatterplot.js,
d3.v3.js, and calvinCollegeSeniorScores.csv to an empty directory, and work
from those files. Turn in your edited versions of them using
turnin.
Extra credit: staggered transitions
For extra credit worth 25% of any future or past assignment: instead of making a plain transition between SATM and SATV scores, create a staggered transition (see the d3 wiki for more details). The first points to move should be the ones with the smallest GPA; the last points to move should be the ones with the highest GPA. In addition, the transition between the point positions should only happen after the axis transition is finished.
Play around with the transition delays and durations until you find something that looks nice.
Hints
You have two weeks to finish this assignment. The fact that this is a hint should give you an estimate of the relative difficulty. Plan accordingly.
The fill color for SVG rectangles, by default, can only be a single color. For the color legend, you will have to implement a color gradient by creating many small rectangles, each with a slightly different color.
Hints, take 2
Update, Feb 23rd. It seems like folks are having trouble with the description of the task. Here’s what your final submission should look like, roughly: