2D Vector fields
- Posting date: Apr 19th
- Due date: Apr 26th
- GitHub classroom link
In this assignment, you will implement some techniques for visualizing vector fields. Specifically, you will implement three techniques based on glyph drawing, and one technique based on colormapping. For this assignment, we will be using synthetic data, because of its simplicity.
As usual, you will build on skeleton code we provide.
note: there was a problem in the screenshots of the uniform and randomly-placed arrow glyphs. It has been now fixed. Thank you, Steven Eiselen and Jesse Bartels for catching and reporting it.
Data
The data is provided in one array: data. This array contains objects
which look like this:
{
    "vx": x-component-of-vector,
    "vy": y-component-of-vector,
    "Col": 0,
    "Row": 0
}
Part 1: Colormap rectangles based on vector magnitude (20 points)
Implement a colormap that will show the different magnitudes of the vectors in the field using filled rectangles, one per cell. Use an appropriate colormap.
Part 2: Hedgehog Plots (30 points)
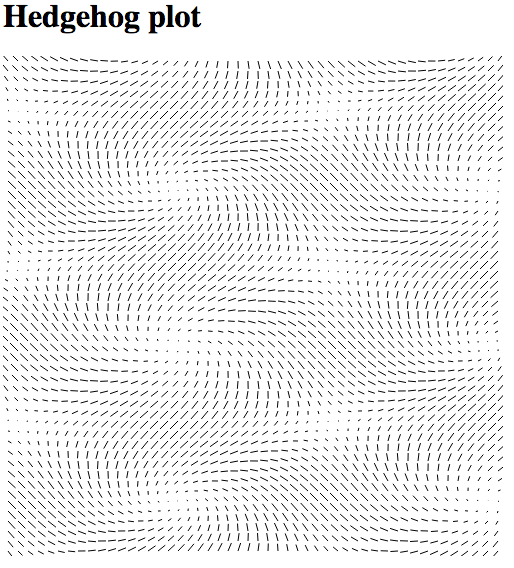
Implement code to draw a hedgehog plot: a plot that shows arrows by drawing lines starting at the vector origin, pointing in the direction of the arrow, with length proportional to the vector’s magnitude.
The solution will look somewhat like this:

Part 3: Uniformly-placed Arrow glyphs (30 points)
Implement code to draw arrow glyphs such that arrows start at the
center of each cell, have lengths proportional to the magnitude of the
vector field, and point in the right direction. Use the SVG path
element for this.
Hint 1: It’s easier to draw the arrow pointing in one fixed
direction, and then rotate the entire arrow using the appropriate
SVG commands. You will also likely want to use
Math.atan2.
Hint 2: SVG transform attributes can have more than one instruction. See the example “Rotating and translating and SVG element” in the MDN documention.
The solution will look somewhat like this:

Part 4: Randomly-placed Arrow glyphs (30 points)
Implement code to draw arrow glyphs like above, but instead of being placed at the center of the cell, the arrows are randomly placed inside each cell.
The solution will look somewhat like this:

Files
- main.js is the skeleton you will build on (implement the functions commented with “write this”),
- index.html has the HTML you’ll need, and
- data.js has the data you will use.